
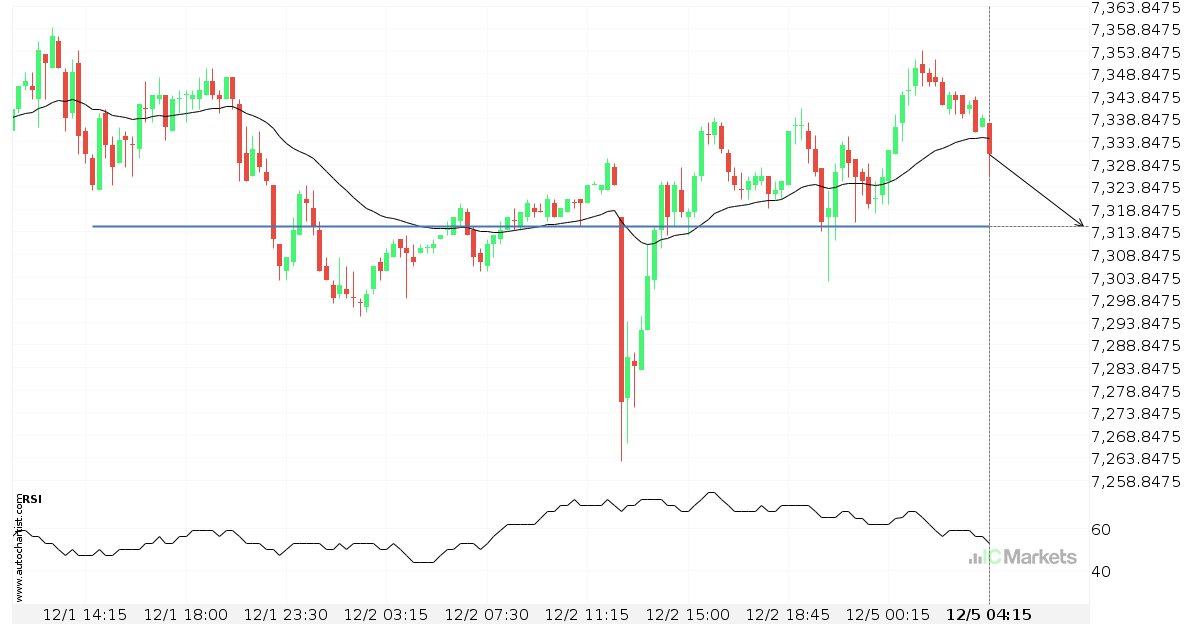
Australia 200 Index – getting close to psychological price line
Australia 200 Index is moving towards a support line. Because we have seen it retrace from this level in the past, we could see either a break through this line, or a rebound back to current levels. It has touched this line numerous times in the last 4 days and may test it again within […]
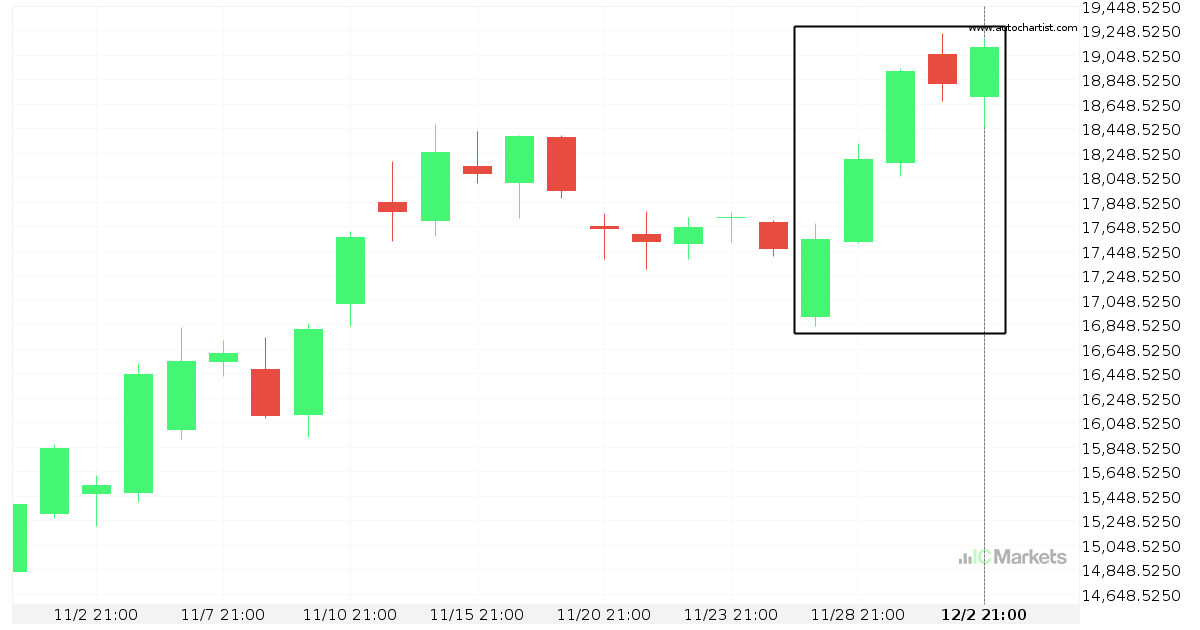
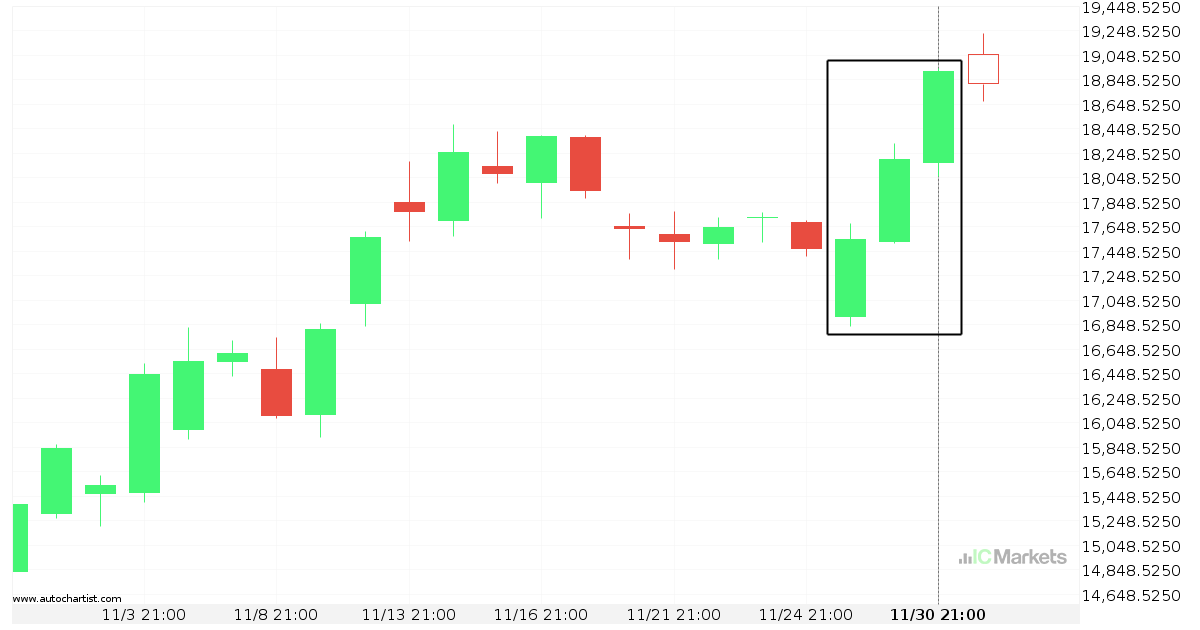
Huge bullish move on Hong Kong 50 Index
Hong Kong 50 Index has moved higher by 8.88% from 17547.3 to 19105.9 in the last 6 days.
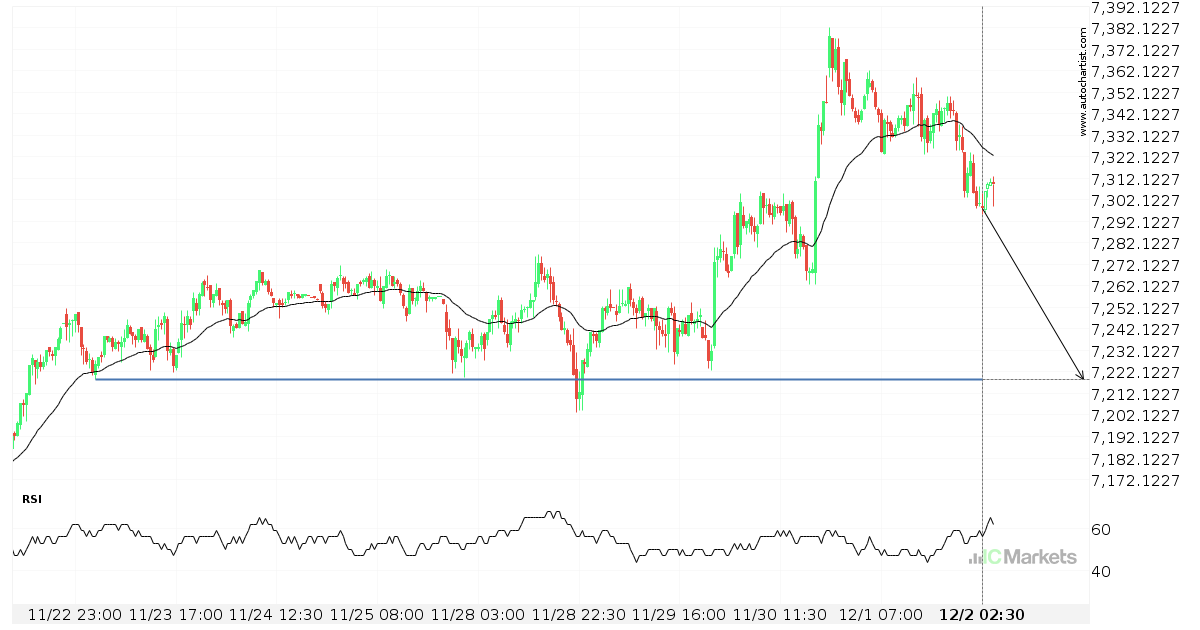
A final push possible on Australia 200 Index
Australia 200 Index is heading towards 7218.6602 and could reach this point within the next 2 days. It has tested this line numerous times in the past, and this time could be no different, ending in a rebound instead of a breakout. If the breakout doesn’t happen, we could see a retracement back down to […]
Huge bullish move on Hong Kong 50 Index
Hong Kong 50 Index has moved higher by 7.79% from 17547.3 to 18914.2 in the last 4 days.
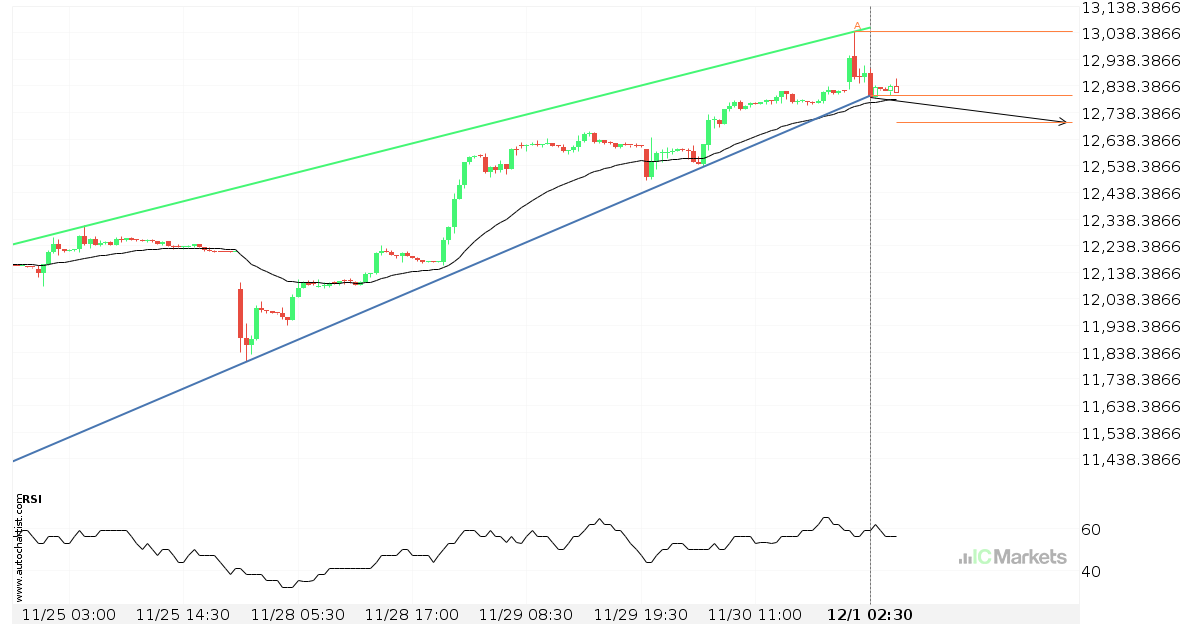
FTSE China A50 Index has broken through support
FTSE China A50 Index has broken through a support line. It has touched this line at least twice in the last 7 days. This breakout may indicate a potential move to 12702.0515 within the next 22 hours. Because we have seen it retrace from this position in the past, one should wait for confirmation of […]
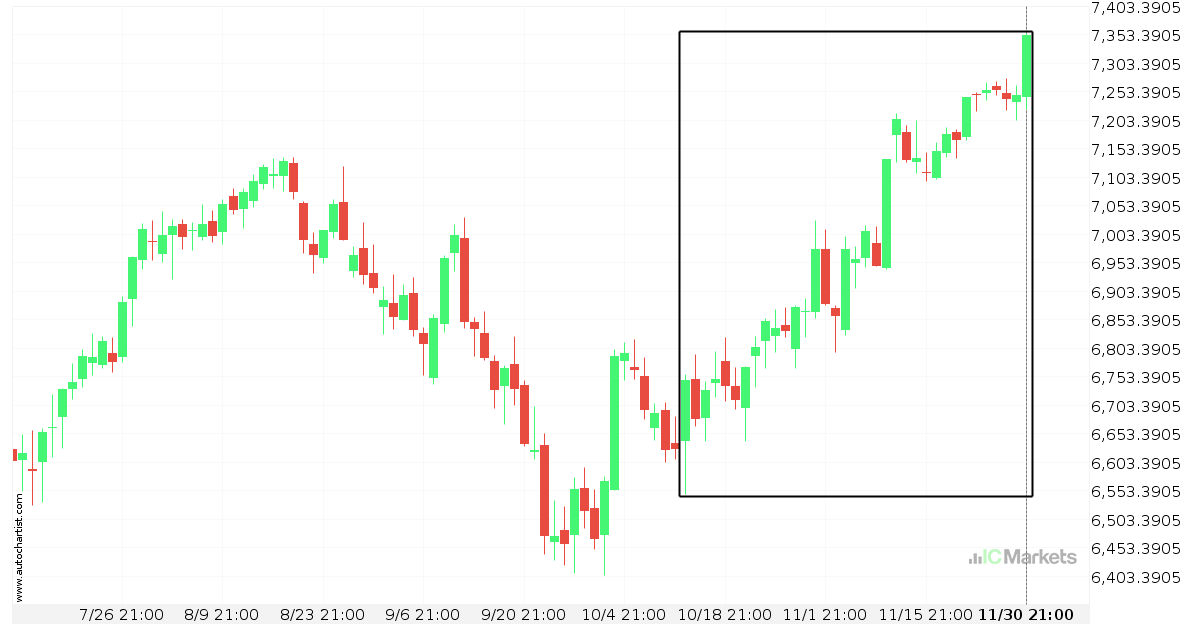
Australia 200 Index is on its way up
Australia 200 Index has experienced an exceptionally large movement higher by 8.97% from 6746.72 to 7351.82 in the last 50 days.
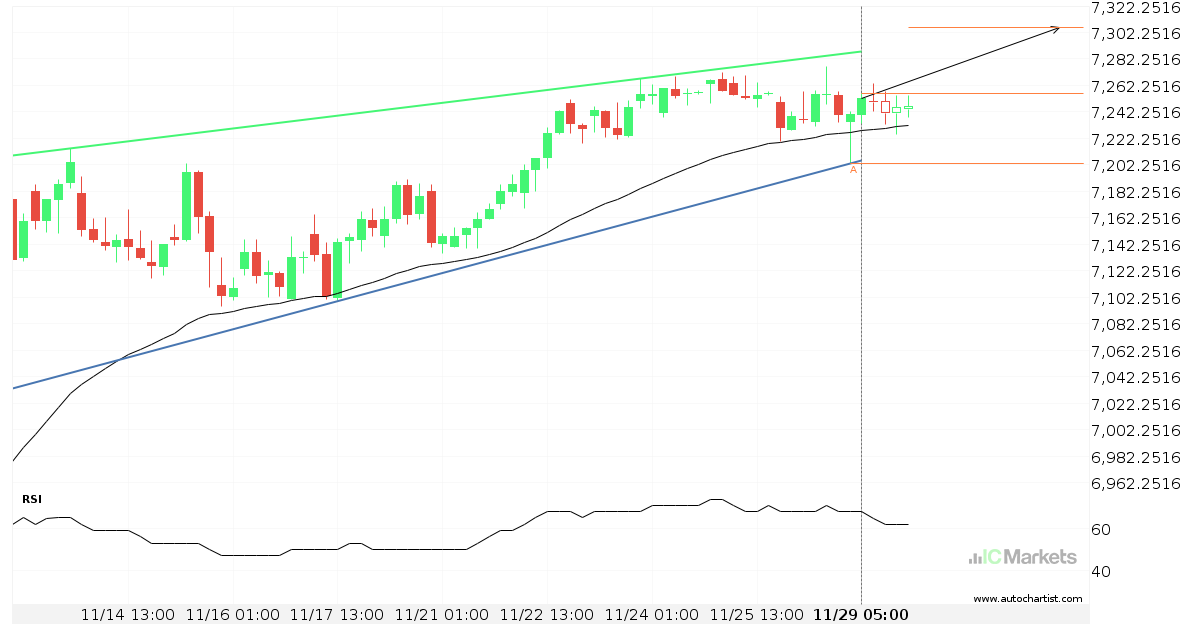
Either a rebound or a breakout imminent on Australia 200 Index
Australia 200 Index is heading towards the resistance line of a Rising Wedge. If this movement continues, the price of Australia 200 Index could test 7305.8724 within the next 4 days. It has tested this line numerous times in the past, so this movement could be short-lived and end up rebounding just like it did […]
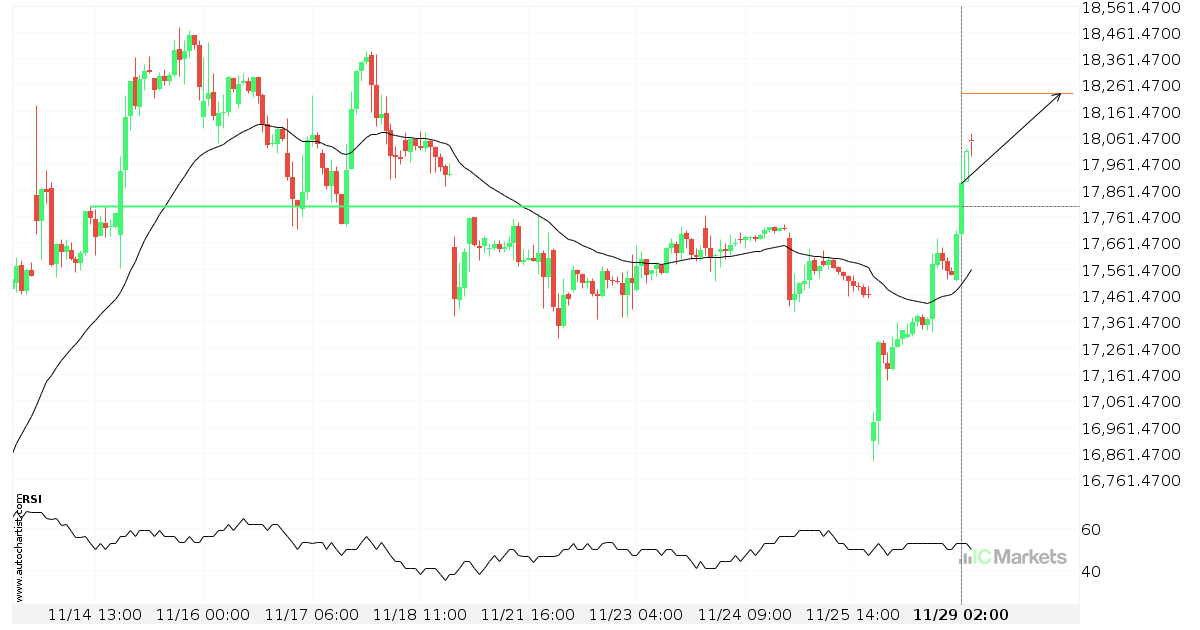
Hong Kong 50 Index – psychological price line breached
Hong Kong 50 Index has broken through a resistance line. Because we have seen it retrace from this price in the past, one should wait for confirmation of the breakout before trading. It has touched this line numerous times in the last 15 days and suggests a possible target level to be around 18228.1797 within […]
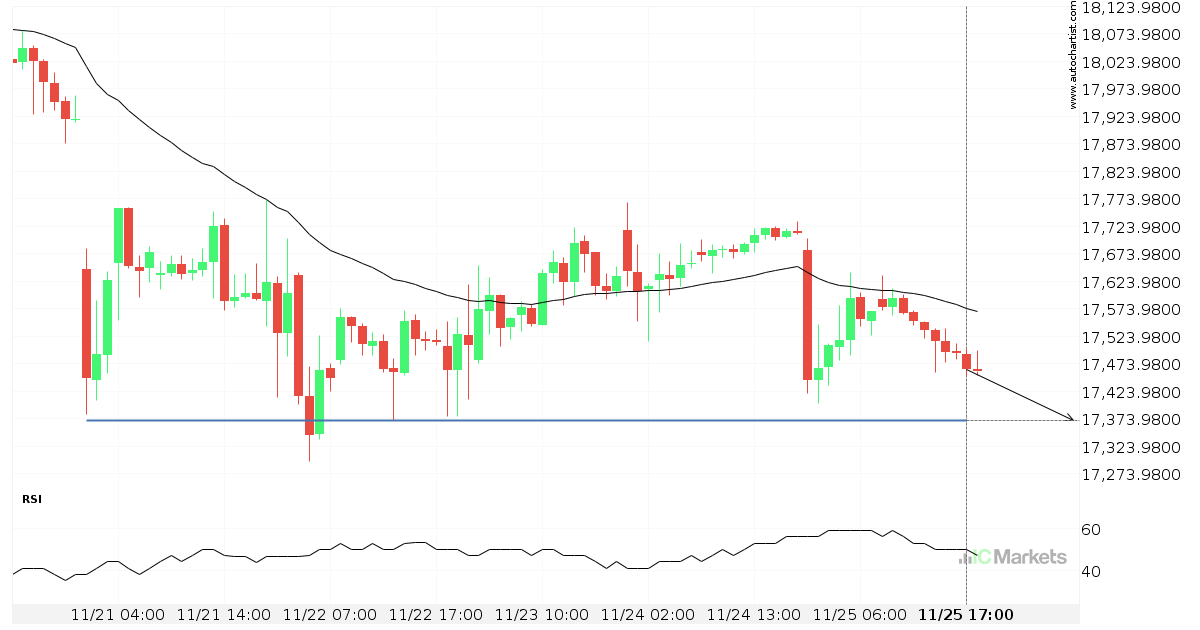
A final push possible on Hong Kong 50 Index
Hong Kong 50 Index is heading towards 17371.5996 and could reach this point within the next 19 hours. It has tested this line numerous times in the past, and this time could be no different, ending in a rebound instead of a breakout. If the breakout doesn’t happen, we could see a retracement back down […]
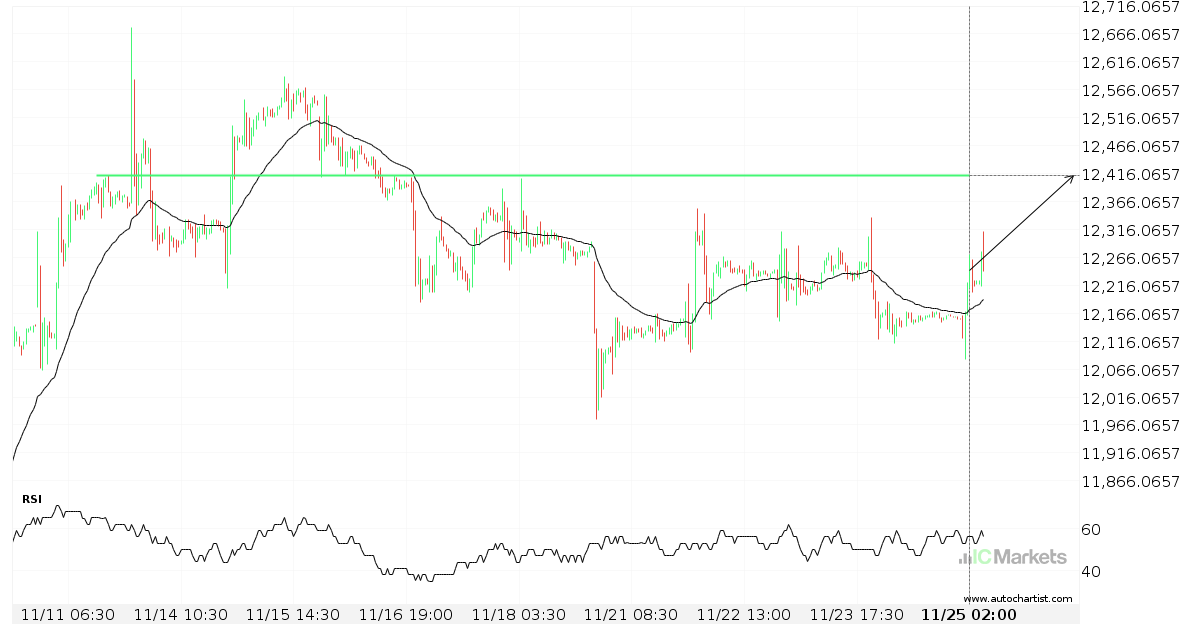
Breach of important price line imminent by FTSE China A50 Index
FTSE China A50 Index is moving towards a line of 12413.1299 which it has tested numerous times in the past. We have seen it retrace from this position in the past, so at this stage it isn’t clear whether it will breach this price or rebound as it did before. If FTSE China A50 Index […]